With the last two years presenting many challenges for businesses in hospitality and changes to how their customers behave, many have had to look at ways to upgrade and invest in their commercial spaces.
With this in mind, and a 100% increase in searches for the term “UK regeneration projects” over the last 12 months¹, we delved into the number of empty commercial properties across the UK in February 2019 and 2022 in order to identify the areas with the biggest opportunity for regeneration².
Altogether, there were 89,371 empty commercial buildings across the UK in February 2022, a 21% increase compared to pre-pandemic (February 2019).

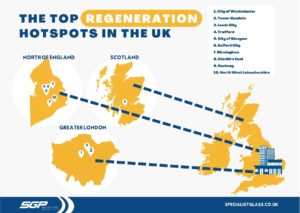
Central London has the most prominent opportunity for regeneration as local councils, the City of Westminster and London Borough of Tower Hamlets, take the top two spots. A total of 8,456 commercial properties were empty and available in the City of Westminster and 3,784 in the London Borough of Tower Hamlets.
According to the UK Regeneration Hotspot list, the northern city of Leeds is the third biggest area of opportunity for regeneration. If you were hoping to relocate your business to God’s Own Country, 3,567 buildings are currently unoccupied in Leeds. Other northern areas to make the top ten include Trafford Council (2967) and the City of Glasgow (2758).
The results suggests both councils in the North and South have an equal opportunity for regeneration, with four councils each in the top ten. Two local councils from the Midlands also made the top ten, Birmingham (2153) and North West Leicestershire (1160).`
Here is a breakdown of the top 20 regeneration hotspots³:
| Local Council | Number of Empty Properties |
Difference (%) |
|
| 2019 | 2022 | ||
| 1. City of Westminster | 6736 | 8456 | +26% |
| 2. London Borough of Tower Hamlets | 3049 | 3784 | +24% |
| 3. Leeds City Council | 3466 | 3567 | +3% |
| 4. Trafford Council | 2832 | 2967 | +5% |
| 5. City of Glasgow | 2721 | 2758 | +1% |
| 6. Salford City Council | 3720 | 2178 | -41% |
| 7. Birmingham City Council | N/A | 2153 | N/A |
| 8. Cheshire East | 1335 | 1625 | +22% |
| 9. London Borough of Hackney | 968 | 1461 | +51% |
| 10. North West Leicestershire | 1328 | 1160 | +13% |
| 11. Wolverhampton City Council | 1219 | 1095 | -10% |
| 12. London Borough of Hillingdon | 442 | 1082 | +145% |
| 13. Wirral Metropolitan Borough | N/A | 1053 | N/A |
| 14. Doncaster Metropolitan Borough Council | 1005 | 1022 | +2% |
| 15. Rochdale Metropolitan Borough Council | 905 | 1010 | +12% |
| 16. Sunderland City Council | 1047 | 993 | -5% |
| 17. London Borough of Hounslow | 1104 | 936 | -15% |
| 18. Blackburn with Darwen Borough Council | 1076 | 932 | -13.38% |
| 19.Preston City Council | 1074 | 878 | -18% |
| 20. Tameside Metropolitan Borough Council | 928 | 869 | -6% |
Our new study also revealed which local councils were most impacted by COVID-19 by comparing the number of empty commercial properties in 2022 against 2019. Of the councils which held the information, St Albans City & District Council was the most impacted with an 855% increase in empty commercial properties (+171).
Here is a breakdown of the top 20 local councils most impacted by COVID-19⁴:
|
Local Council |
Number of Empty Properties | Impact from COVID-19 (%) |
| 1. St Albans City & District Council | 171 | +855% |
| 2. Inverclyde Council | 14 | +700% |
| 3. Western Isles Council | 114 | +518% |
| 4. Fenland District Council | 22 | +366% |
| 5. Chelmsford Borough Council | 466 | +358% |
| 6. Reigate and Banstead Borough Council | 218 | +193% |
| 7. London Borough of Hillingdon | 640 | +144% |
| 8. Newark and Sherwood District Council | 173 | +108% |
| 9. North Kesteven District Council | 149 | +103% |
| 10. Chorley Borough Council | 3 | +100% |
| 11. Warwick District Council | 203 | +76% |
| 12. East Renfrewshire Council | 2 | +67% |
| 13. Hartlepool Borough Council | 133 | +63% |
| 14. East Hampshire District Council | 155 | +62% |
| 15. Rutland County Council | 8 | +62% |
| 16. London Borough of Hackney | 493 | +51% |
| 17. Canterbury City Council | 99 | +41% |
| 18. Winchester City Council | 102 | +39% |
| 19. Lancaster City Council | 147 | +37% |
| 20. Craven District Council | 12 | +34% |
Andrew Taylor, managing director at Specialist Glass Products, commented on the study: “It has been a testing couple of years for many businesses with multiple lockdowns and restrictions, Brexit and inflation in energy and cost of living.
“Hospitality businesses, in particular, have had to find ways to adapt to the new ways of living by sourcing new commercial space with large external areas that are more sustainable. When searching for an area to invest in, business owners should always be on the lookout for areas pushing regeneration; this is often an indication of future growth and demand.
“If you would prefer to stay where you are and simply adapt current space, business owners should seek alternate materials such as glass which has many functional and decorative qualities. Structural glass can be used to create outdoor dining spaces such as roofing and balustrading, glass dining pods and takeaway windows with greater security from severe weather and durability in elevated temperatures.
“With July temperatures averaging a daily high of 21 degrees Celsius in the UK, indoor temperatures can get stuffy and uncomfortable, especially if in direct sunlight. By implementing energy-efficient coated glass into commercial design, you can help keep interiors cool in the hotter months and warm in the colder months.”
How can Specialist Glass Products help you?
Our double glazed, toughened, laminated or curved glass can be used in many different formats and commercial environments, from walls and balustrading to flooring and staircases.
If you’re looking for ways to adapt your commercial space, get in touch today or make sure to follow us on Linkedin, Facebook, Twitter or Instagram
Methodology and Sources
To create our UK Regeneration Hotspot list, we issued Freedom of Information (FOI) requests to 423 local councils to discover the number of empty commercial properties across the UK in February 2019 and 2022. From the data found, we were able to identify the areas with the biggest opportunity for regeneration and those impacted the most by the COVID-19 pandemic.
- Search volume data for the term “UK regeneration projects” is correct as of May 2022
- Data was received from 175 out of 423 local councils by a Freedom of Information Request on the number of empty commercial properties in February 2019 and February 2022.
- Calculated by the number of commercial properties available per local council in 2022
- Calculated by the increase in number of commercial properties available from 2019 to 2022


